Contents
1. Plugin Overview
Sandra Analyst analyzes WooCommerce sales data and turns user questions into ready-to-use reports.
Reports may include:
- text summaries,
- tables,
- charts,
- a list of executed SQL queries (technical section in report details).
After activation, the following menu items are available in the WordPress admin panel:
- Sandra Analyst (main menu),
- Ask Sandra (subpage for questions and report generation),
- All Reports (list of all reports).

An active connection to a WP Desk account is required for report generation.
You can start the connection process in two ways:
- Go to the plugins list and use the Connect WP Desk Account link next to the plugin (when not connected).
- Use the Connect WP Desk Account link in Sandra's interface when a connection error is shown.
- Click Connect WP Desk Account.
- Sign in to your WP Desk account and confirm the site connection.
- Return to WordPress admin, where the plugin stores the connection data.
- Open Ask Sandra after redirect.
- Check the success notice confirming Sandra is ready to analyze your store data.
During connection, you may see errors related to:
- invalid or expired authorization code,
- authorization request mismatch with account/site,
- site already connected to another WP Desk account,
- license eligibility restrictions.
In such cases, try connecting again or contact WP Desk support.
4. Ask Sandra Screen (Report Creation)
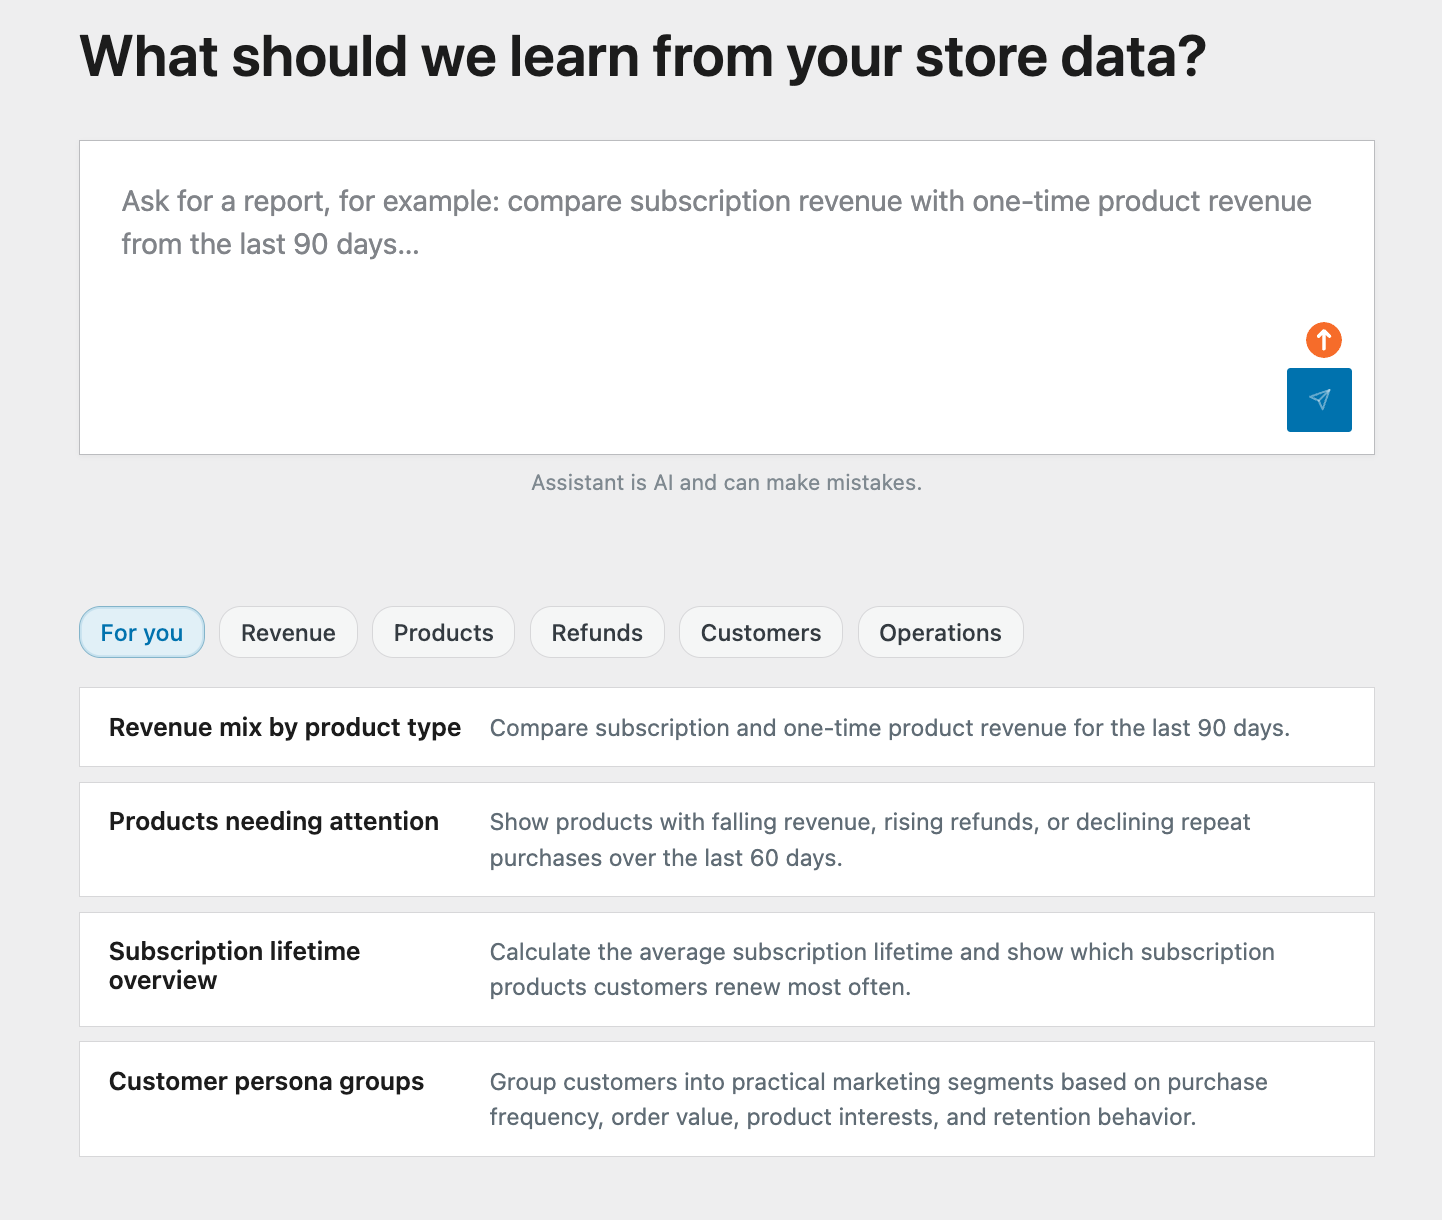
The Ask Sandra screen includes:
- the Analytics query input,
- the Generate report button,
- predefined question suggestions (topic categories),
- status and error notices,
- an AI limitation notice (possible mistakes).
Question suggestions
Below the query box, you can use categories and predefined prompts, for example:
- For you,
- Revenue,
- Products,
- Refunds,
- Customers,
- Operations.
Clicking a suggestion automatically fills the query field.
What happens after clicking Generate report
- If report creation starts successfully, the user is redirected to report details.
- If report processing continues in the background, a notice and a View All Reports link appear.
- If something fails, an error notice is shown (including a reauthorization link when needed).
5. All Reports Screen (Report List)
The All Reports view contains a reports table and filtering tools.
List elements
- Status filters: All, Completed, Running, Pending, Failed.
- Columns: Report Title, Status, Date.
- Date sorting (ascending/descending).
- Pagination (first/previous/next/last page).
Monthly limit
If quota is active, a counter appears above the table:
Monthly reports remaining: X / Y.
Empty states
- No reports at all: a message encourages creating the first report.
- No reports for selected status: a dedicated no-match message is shown.
6. Report Detail View
Clicking a report title opens the detail view.
Main elements
- Back to Reports link.
- Report header (title + generation date or status).
- Research Question block (original prompt).
- Report content (text, tables, charts).
Report statuses
- Pending / Running: progress view and loading skeleton.
- Completed: full report content.
- Failed: error message with retry/narrow-query guidance.
User feedback
For completed reports (without previously submitted feedback), a feedback module is displayed:
- Rating: Useful, Mixed, Not useful.
- (Optional) Issue tags, for example Incorrect data, Too slow.
- (Optional) Text comment.
After submission, a thank-you message is shown. The module can also be dismissed.
Executed Queries
In report details, you can expand the Executed Queries section:
- it shows SQL queries used to build the report,
- each query can be copied with the Copy button.
7. Working with Reports: Step-by-Step Scenario
- Open Sandra Analyst -> Ask Sandra.
- Enter a question or select a suggested prompt.
- Click Generate report.
- Wait for the result in detail view or go to All Reports.
- Open the report from the list and review findings, tables, and charts.
- (Optional) Rate the report and submit feedback.
8. Example Reports You Can Generate
-
Subscription vs one-time revenue comparison
Example question: "Compare subscription revenue with one-time product revenue from the last 90 days."
Result: side-by-side revenue streams, trend, and percentage share.
-
Largest product revenue increases/decreases
Example question: "Show products with the largest month-over-month revenue increase or decrease."
Result: ranked products by change magnitude with highlighted outliers.
-
Refund analysis by product
Example question: "Group refunds by product for the last 60 days and identify outliers."
Result: product-level refund impact table and risky-item detection.
-
Payment method comparison
Example question: "Compare revenue, failed orders, and refunds by payment method for the last 90 days."
Result: quality comparison of payment channels and their sales impact.
-
Geographic sales snapshot
Example question: "Break down revenue and refund rate by billing country for the last 6 months."
Result: geographic sales distribution with refund risk indicators.
9. Most Common Messages and Their Meaning
- Connect WP Desk Account - no active WP Desk connection or session-related issue.
- Your quota resets on ... - monthly report quota is exhausted; new reports are available after reset.
- I could not create this report... - report generation failed; narrowing date range or scope usually helps.
- No reports yet... - report list is currently empty.
